Prior to the start of our experiments, we began our study of thermodynamics by developing a conversion factor between the Fahrenheit and Celsius temperature scales.

The equipment we used to take measurements for both experiments was Logger Pro with temperature probes. In the thermal conductivity lab, we used the aluminum can submerged in water. The water outside was of a significantly different temperature than the water outside the can and the temp. probes were used to measure the change in heat for both liquids. For the heat capacity lab, the Styrofoam cup was used as a thermal insulator so we could get accurate measurements for the amount of temperature change that took place for an amount of time that the immersion heater was on.

The resulting graph for the thermal conductivity lab displays non-linear relationship between temperature and time, which indicates that the heat exchange decreases when the temperature disparity between the two liquids reduces.

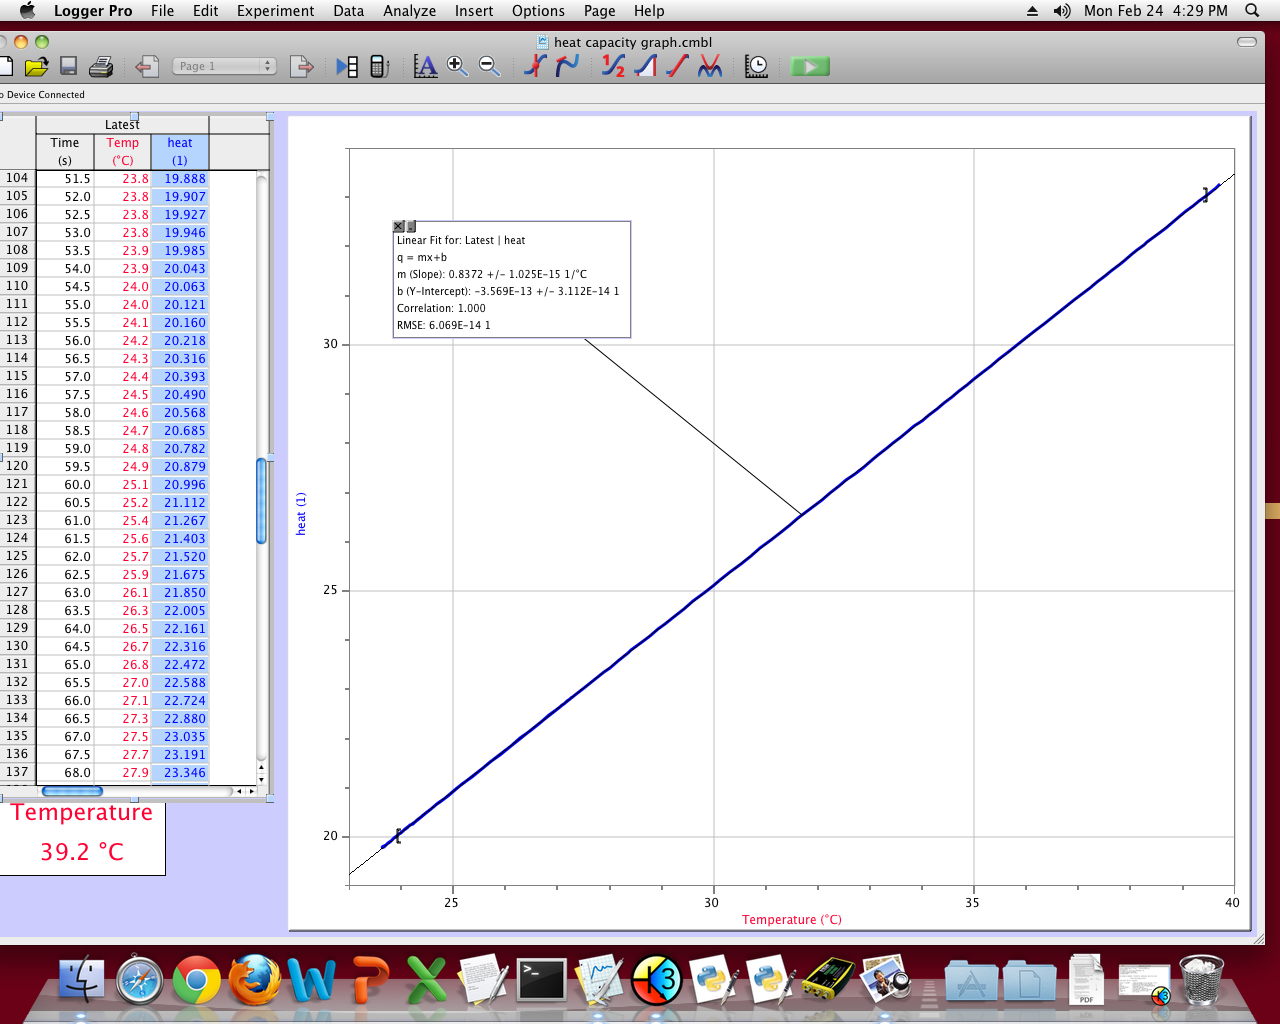
The resulting graph for the heat capacity lab shows a linear relationship between added heat and temperature change. The slope for this graph does not match with the known value of specific heat capacity for water because specific heat takes mass into account, and the displayed graph does not.
No comments:
Post a Comment